Solid Geometry
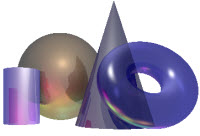
Solid Geometry is the geometry of three-dimensional space,
the kind of space we live in.
the kind of space we live in.
Three Dimensions
 |
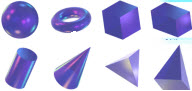
Simple Shapes
Let us start with some of the simplest shapes:
Properties
Solids have properties (special things about them), such as:
- volume (think of how much water it could hold)
- surface area (think of the area you would have to paint)
- how many vertices (corner points), faces and edges they have