Monday, January 20, 2020

ANNULUS

Annulus

annulus r and RAn annulus is a flat shape like a ring.

Its edges are two circles that have the same center.
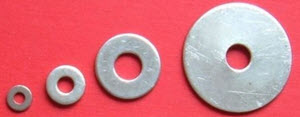
Washers (various)
The face of a metal washer is an annulus
Something shaped like an annulus is said to be annular.
Saturn has annular rings:
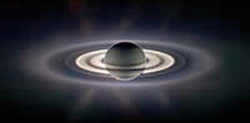
saturn

Area

Because it is a circle with a circular hole, you can calculate the area by subtracting the area of the "hole" from the big circle's area:
annulus area pi R^2 - pi r^2
Area = πR2 − πr2
= π( R2 − r2 )

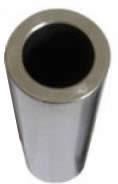
annulus pipe

Example: a steel pipe has an outside diameter (OD) of 100mm and an inside diameter (ID) of 80mm, what is the area of the cross section?

Convert diameter to radius for both outside and inside circles:
  • R = 100 mm / 2 = 50 mm
  • r = 80 mm / 2 = 40 mm
Now calculate area:
Area = π( R2 - r2 )
Area = 3.14159... × ( 502 − 402 )
Area = 3.14159... × (2500 − 1600)
Area = 3.14159... × 900
Area = 2827 mm2 (to nearest mm2)

Thursday, January 16, 2020

BAYES' THEOREM

                      BAYES' THEOREM

       Bayes’ Theorem is a way of finding a probability when we know certain other probabilities.
The formula is:
P(A|B) = P(A) P(B|A)P(B)

Which tells us:how often A happens given that B happens, written P(A|B),
When we know:how often B happens given that A happens, written P(B|A)
and how likely A is on its own, written P(A)
and how likely B is on its own, written P(B)

Let us say P(Fire) means how often there is fire, and P(Smoke) means how often we see smoke, then:

P(Fire|Smoke) means how often there is fire when we can see smoke
P(Smoke|Fire) means how often we can see smoke when there is fire

So the formula kind of tells us "forwards" P(Fire|Smoke) when we know "backwards" P(Smoke|Fire)

Example:
  • dangerous fires are rare (1%)
  • but smoke is fairly common (10%) due to barbecues,
  • and 90% of dangerous fires make smoke

We can then discover the probability of dangerous Fire when there is Smoke:
P(Fire|Smoke) =P(Fire) P(Smoke|Fire)P(Smoke)
=1% x 90%10%
=9%

Monday, January 13, 2020

WHAT IS TREE DIAGRAM?

Probability Tree Diagrams

                Calculating probabilities can be hard, sometimes we add them, sometimes we multiply them, and often it is hard to figure out what to do ... tree diagrams to the rescue!

Here is a tree diagram for the toss of a coin:


probability branch, probability and outcomeThere are two "branches" (Heads and Tails)
  • The probability of each branch is written on the branch
  • The outcome is written at the end of the branch


We can extend the tree diagram to two tosses of a coin:

probability tree 2 tosses of coin


How do we calculate the overall probabilities?

  • We multiply probabilities along the branches
  • We add probabilities down columns


probability tree calculations (multiply and add)

Monday, January 6, 2020

EXPERIMENT WITH A DIE

Activity: An Experiment with a Die

You will need:
  • A single die
single die

Interesting point

Many people think that one of these cubes is called "a dice". But no!
The plural is dice, but the singular is die. (i.e. 1 die, 2 dice.)
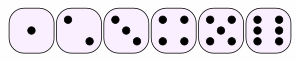
The common die has six faces:
dice faces 1 to 6
We usually call the faces 1, 2, 3, 4, 5 and 6.

High, Low, and Most Likely

Before we start, let's think about what might happen.
Question: If you roll a die:
  • 1. What is the least possible score?
  • 2. What is the greatest possible score?
  • 3. What do you think is the most likely score?
The first two questions are quite easy to answer:
  • 1. The least possible score must be 1
  • 2. The greatest possible score must be 6
  • 3. The most likely score is ... ???

Saturday, January 4, 2020

MEAN FROM FREQUENCY TABLE

The Mean from a Frequency Table

It is easy to calculate the Mean:
Add up all the numbers,
then divide by how many numbers there are.

         But sometimes we don't have a simple list of numbers, it might be a frequency table like this (the "frequency" says how often they occur):
ScoreFrequency
12
25
34
42
51
(it says that score 1 occurred 2 times, score 2 occurred 5 times, etc)
We could list all the numbers like this:

Mean = 1+1 + 2+2+2+2+2 + 3+3+3+3 + 4+4 + 5(how many numbers)
But rather than do lots of adds (like 3+3+3+3) it is easier to use multiplication:

Mean = 2×1 + 5×2 + 4×3 + 2×4 + 1×5(how many numbers)
And rather than count how many numbers there are, we can add up the frequencies:

Mean = 2×1 + 5×2 + 4×3 + 2×4 + 1×52 + 5 + 4 + 2 + 1
And now we calculate:

Mean = 2 + 10 + 12 + 8 + 514
=  3714  =  2.64...

Friday, January 3, 2020

GEOMETRIC MEAN

Geometric Mean

                The Geometric Mean is a special type of average where we multiply the numbers together and then take a square root (for two numbers), cube root (for three numbers) etc.

Example: What is the Geometric Mean of 2 and 18?

  • First we multiply them: 2 × 18 = 36
  • Then (as there are two numbers) take the square root: √36 = 6
In one line:
Geometric Mean of 2 and 18 = √(2 × 18) = 6
It is like the area is the same!
geometric mean 2x18 = 6x6

Example: What is the Geometric Mean of 10, 51.2 and 8?

  • First we multiply them: 10 × 51.2 × 8 = 4096
  • Then (as there are three numbers) take the cube root: 3√4096 = 16
In one line:
Geometric Mean = 3√(10 × 51.2 × 8) = 16
It is like the volume is the same:
geometric mean 10x51.2x8 = 16x16x16

Wednesday, January 1, 2020

MEAN MACHINE

The Mean Machine

See how the Arithmetic Mean (or Average) is calculated:
To find the Mean (or Average) divide the
Sum of the numbers by the Count of the numbers
 Numbers: 
7
7
21
7
= 3
 Count
 Sum
 Count
Divide
© 2016 MathsIsFun.com v0.61


How to Find the Mean

The mean is the average of the numbers.

It is easy to calculate: add up all the numbers, then divide by how many numbers there are.
In other words it is the sum divided by the count.

Example 1: What is the Mean of these numbers?

6, 11, 7
  • Add the numbers: 6 + 11 + 7 = 24
  • Divide by how many numbers (there are 3 numbers): 24 / 3 = 8

The Mean is 8