Monday, January 6, 2020

EXPERIMENT WITH A DIE

Activity: An Experiment with a Die

You will need:
  • A single die
single die

Interesting point

Many people think that one of these cubes is called "a dice". But no!
The plural is dice, but the singular is die. (i.e. 1 die, 2 dice.)
The common die has six faces:
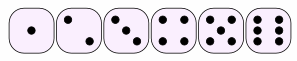
dice faces 1 to 6
We usually call the faces 1, 2, 3, 4, 5 and 6.

High, Low, and Most Likely

Before we start, let's think about what might happen.
Question: If you roll a die:
  • 1. What is the least possible score?
  • 2. What is the greatest possible score?
  • 3. What do you think is the most likely score?
The first two questions are quite easy to answer:
  • 1. The least possible score must be 1
  • 2. The greatest possible score must be 6
  • 3. The most likely score is ... ???
Saturday, January 4, 2020

MEAN FROM FREQUENCY TABLE

The Mean from a Frequency Table

It is easy to calculate the Mean:
Add up all the numbers,
then divide by how many numbers there are.

         But sometimes we don't have a simple list of numbers, it might be a frequency table like this (the "frequency" says how often they occur):
ScoreFrequency
12
25
34
42
51
(it says that score 1 occurred 2 times, score 2 occurred 5 times, etc)
We could list all the numbers like this:

Mean = 1+1 + 2+2+2+2+2 + 3+3+3+3 + 4+4 + 5(how many numbers)
But rather than do lots of adds (like 3+3+3+3) it is easier to use multiplication:

Mean = 2×1 + 5×2 + 4×3 + 2×4 + 1×5(how many numbers)
And rather than count how many numbers there are, we can add up the frequencies:

Mean = 2×1 + 5×2 + 4×3 + 2×4 + 1×52 + 5 + 4 + 2 + 1
And now we calculate:

Mean = 2 + 10 + 12 + 8 + 514
=  3714  =  2.64...

Friday, January 3, 2020

GEOMETRIC MEAN

Geometric Mean

                The Geometric Mean is a special type of average where we multiply the numbers together and then take a square root (for two numbers), cube root (for three numbers) etc.

Example: What is the Geometric Mean of 2 and 18?

  • First we multiply them: 2 × 18 = 36
  • Then (as there are two numbers) take the square root: √36 = 6
In one line:
Geometric Mean of 2 and 18 = √(2 × 18) = 6
It is like the area is the same!
geometric mean 2x18 = 6x6

Example: What is the Geometric Mean of 10, 51.2 and 8?

  • First we multiply them: 10 × 51.2 × 8 = 4096
  • Then (as there are three numbers) take the cube root: 3√4096 = 16
In one line:
Geometric Mean = 3√(10 × 51.2 × 8) = 16
It is like the volume is the same:
geometric mean 10x51.2x8 = 16x16x16

Wednesday, January 1, 2020

MEAN MACHINE

The Mean Machine

See how the Arithmetic Mean (or Average) is calculated:
To find the Mean (or Average) divide the
Sum of the numbers by the Count of the numbers
 Numbers: 
7
7
21
7
= 3
 Count
 Sum
 Count
Divide
© 2016 MathsIsFun.com v0.61


How to Find the Mean

The mean is the average of the numbers.

It is easy to calculate: add up all the numbers, then divide by how many numbers there are.
In other words it is the sum divided by the count.

Example 1: What is the Mean of these numbers?

6, 11, 7
  • Add the numbers: 6 + 11 + 7 = 24
  • Divide by how many numbers (there are 3 numbers): 24 / 3 = 8

The Mean is 8

Monday, December 30, 2019

HISTOGRAMS

Histograms

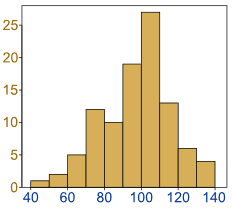
Histogram: a graphical display of data using bars of different heights.

Histogram

It is similar to a Bar Chart, but a histogram groups numbers into ranges .
The height of each bar shows how many fall into each range.
And you decide what ranges to use!


DIFFERENCE BETWEEN BAR GRAPH AND HISTOGRAM:


bar chart vs histogram

Friday, December 27, 2019

BAR GRAPH

Bar Graphs

A Bar Graph (also called Bar Chart) is a graphical display of data using bars of different heights.
Imagine you just did a survey of your friends to find which kind of movie they liked best:
Table: Favorite Type of Movie
ComedyActionRomanceDramaSciFi
45614
We can show that on a bar graph like this:
Favorite Type of Movie
                It is a really good way to show relative sizes: we can see which types of movie are most liked, and which are least liked, at a glance.
               We can use bar graphs to show the relative sizes of many things, such as what type of car people have, how many customers a shop has on different days and so on.

Monday, December 23, 2019

DATA

What is Data?

Data is a collection of facts, such as numbers, words, measurements, observations or even just descriptions of things.

Qualitative vs Quantitative

Data can be qualitative or quantitative.
  • Qualitative data is descriptive information (it describes something)
  • Quantitative data is numerical information (numbers)
Types of Data
Quantitative data can be Discrete or Continuous:
  • Discrete data can only take certain values (like whole numbers)
  • Continuous data can take any value (within a range)

More Examples

Qualitative:
  • Your friends' favorite holiday destination
  • The most common given names in your town
  • How people describe the smell of a new perfume
Quantitative:
  • Height (Continuous)
  • Weight (Continuous)
  • Petals on a flower (Discrete)
  • Customers in a shop (Discrete)